Make the World Better

GHG Emissions Report – 2024

Overview
This report summarizes the greenhouse gas (GHG) emissions associated with the university’s operations for the year 2024. Emissions have been categorized in accordance with the GHG Protocol into Scope 1 and Scope 2 sources  

Total GHG Emissions: 10922.67 tons CO₂e

Scope 1 Emissions: 1,182.95 tons CO₂e

Scope 2 Emissions: 6,080.11 tons CO₂e

• Scope 3 Emissions: 3659.6 tons CO₂e

GHG Emissions Breakdown

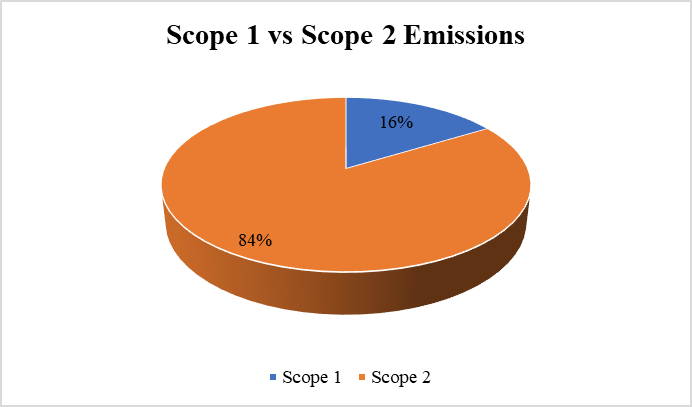
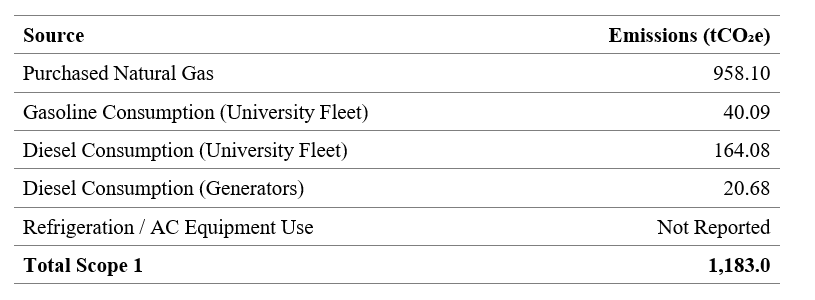
Scope 1 – Direct Emissions

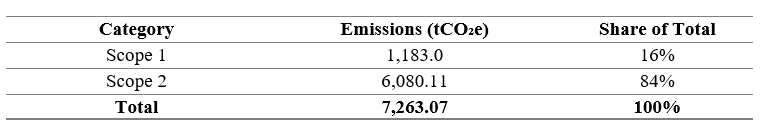
Scope 1 emissions include direct GHG emissions from sources owned or controlled by the university. This includes natural gas use, fleet fuel consumption, and diesel generator usage.

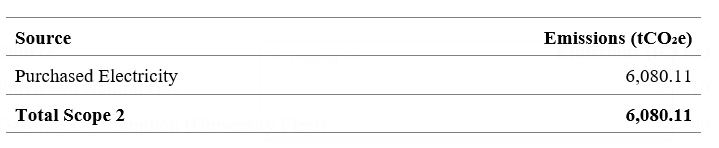
Scope 2 – Indirect Emissions

Scope 2 emissions are indirect GHG emissions from the generation of purchased electricity consumed by NUST.

Total GHG Emissions (Scope 1 + Scope 2)

Graphical Representation

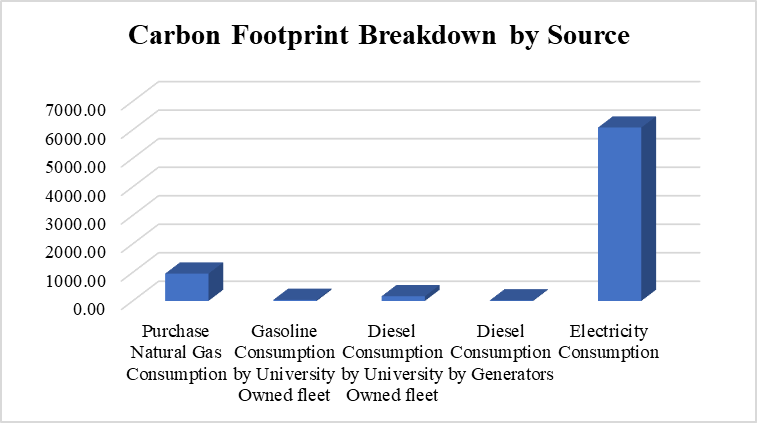
1. GHG Emissions by Source

This chart visualizes emissions from each specific energy source, highlighting the dominant contribution from electricity use.

2. GHG Emissions by Scope

Scope 2 emissions from electricity account for 84% of total emissions, while Scope 1 sources collectively contribute 16%, emphasizing the importance of decarbonizing the energy supply.


Scope 2 emissions from electricity account for 84% of total emissions, while Scope 1 sources collectively contribute 16%, emphasizing the importance of decarbonizing the energy supply.

Contacts

Subscribe Newsletter

Signup our newsletter to get update information, news & insight